Using marks:
Waypoints
Tracks
Routes
Areas
Images
Scales
Mark properties
Elevation data for most of the world’s land surface has been available since the 2000 NASA/NGA Shuttle Radar Topography Mission.
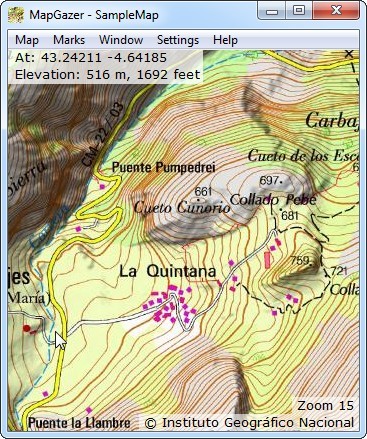
MapGazer uses the ‘3-second-arc’ (a grid of up to 90m/300feet) data from that mission. You can download the elevation data for the area you are interested in (see below for details), and then when moving the cursor over a map you should see the elevation as well as the latitude and longitude displayed in the status at the top left of the window (see screenshot).
Sample map and elevation data
The MapGazer package includes a sample map (MapGazer\MGMaps\SampleMap) and also some sample elevation data that includes the area of that map (MapGazer\elevation3\samples\N43W005.hgt). If you load the SampleMap and move the cursor over the map, you should see elevations appear, similar to those shown in the screenshot.
To copy elevation data to the clipboard, right-click on a point on a map, select Details, then click Elevation to copy the elevation data for that point to the clipboard.
To select the units used for elevations, select Settings → Measurement units on the menu bar; here you can choose any or all of Metric, Statute (customary), or Nautical units.
Downloading elevation data for your maps
A conveniently packaged and cleaned-up version of the Shuttle mission elevation data can be found on Jonathan de Ferranti’s website, where there is also a simple interactive download interface by Christoph Hormann.
Clicking on the Download data: ... 3″ link on that web page takes you to the selection map for 3″ elevation data. Each of the smaller darker-blue rectangles on that map represents a 6°×4° area. If you move the cursor over a rectangle you’ll see the “name” of that rectangle (e.g., the one over northwest Spain is ‘K29’). Left-clicking on a rectangle will initiate download of the data (e.g., K29.zip).
After download, the zip file must be unzipped into a folder that is known to MapGazer. This can be the MapGazer\elevation3 folder, or it may be a specified folder of your choosing (see Settings → Data Folders – be careful to select the containing directory, not a subdirectory such as K29). If you specify an Elevations data folder, this will be searched first (before the MapGazer\elevation3 directory).
In either case, unzipping the downloaded file should create a folder of the same name as the zip file, and in that folder there should be from one to 24 data files (data files that are wholly sea level are omitted), each covering one degree in both latitude and longitude and named with its coordinates (for example, one of the northwest Spain files would be MapGazer\elevation3\K29\N42W007.hgt if downloaded into MapGazer\elevation3). Do not change either the folder name or the file name because MapGazer would then not be able to locate the data.
Once the data file is unzipped the elevation should appear (similar to that shown in the screenshot above) whenever the cursor is moved over the corresponding area.
Accuracy of elevation data
The accuracy of elevation data varies (for more information, see the ViewfinderPanoramas dem3 page). Note also that the elevation data is taken from a grid of points 3 seconds of arc (up to 92.5 metres) apart. MapGazer interpolates between these points, but note that if the points straddle a narrow feature or are on rugged terrain, for example, the elevation shown may not match spot heights and contours shown on the map. Many maps, too, have inaccurate heights and contours.
Naming of elevation data files
Each data folder covers 6°×4° with latitude labels ‘A’ (0°→4°) through ‘U’ (80°→84°) in the Northern hemisphere and the same, prefixed with ‘S’, in the southern hemisphere. Some special-case names are used for Antarctica. The longitude labels are ‘01’ (180°→174°W) through ‘60’ (174°→180°E).
For example, K30 covers 40°→44°N, 6°W→0° (North-central Spain).
Within each folder, the files are of type .hgt, and each file name indicates the bottom-left coordinates of a 1°×1° area, e.g., N43W005.hgt; there may be up to 24 data files in each folder (areas that are wholly sea level are omitted).
